The Best Landscaped Cities in the U.S.
1. Seattle, Washington
| The Best Landscaped Cities in the U.S. | ||
| TPL Parkscore | 5pts | Ranked #8 |
| Tree Equity Score | 5pts | Score 90 |
| Public Art | 5pts | 400 pieces of public art |
| Sports Facilities | 5pts | 200 public sports fields/facilities |
| Bike Infrastructure | 5pts | 29 miles of protected bike lanes, 4 miles of unprotected bike lanes, and 29 neighborhood greenways |
Seattle, WA secured our top spot for America’s best landscaped cities. Seattle ranked number 8 for TPL Parkscore, meaning the city strives to maintain park access for all residents. Seattle also brags a Tree Equity Score of 90, keeping things healthy, shady, and green.
Seattle has a vibrant public art scene with roughly 400 pieces of permanently sited artworks displayed across the city, and over 200 sport facilities to keep residents active and entertained.
The Emerald City is biker friendly, too, with 29 miles of protected bike lanes, 4 miles of unprotected bike lanes, and 29 neighborhood greenways. Protected bike lanes ensure that bikers can ride safely, with barriers and ample room to maneuver through the city.
2. Portland, Oregon
| The Best Landscaped Cities in the U.S. | ||
| TPL Parkscore | 5pts | Ranked #9 |
| Tree Equity Score | 4pts | Score 88 |
| Public Art | 3pts | 120 pieces of public art |
| Sports Facilities | 5pts | 300 public sports fields/facilities |
| Bike Infrastructure | 5pts | 400 miles of bikeways and 100 miles of low-stress greenways |
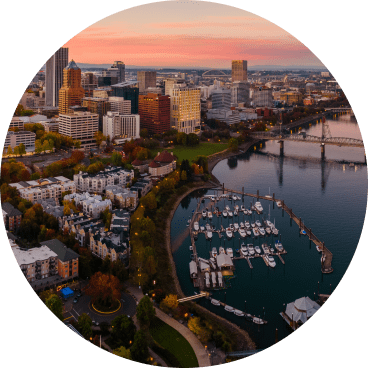
It might seem like we’re favoring the Pacific Northwest but both Seattle, WA and Portland, OR have taken extra care to maintain an accessible, equitably-landscaped city. Portland takes second place with a TPL Parkscore ranking of 9 and a Tree Equity Score of 88. It probably doesn’t hurt that the city gets an average of 36 inches of rain per year.
Portland’s public art scene helps define the city as a vibrant urban art community, with 120 outdoor pieces to browse while exploring the city streets.
Want sports? Portland’s got ‘em! With over 300 public sports facilities Portland has no shortage of soccer fields, baseball diamonds, and tennis courts to fill your weekend. If tennis isn’t your thing, not to worry, a leisurely bike ride is made easy with 400 miles of bikeways and 100 miles of low-stress greenways.
3.Washington, D.C.
| The Best Landscaped Cities in the U.S. | ||
| TPL Parkscore | 5pts | Ranked #1 |
| Tree Equity Score | 4pts | Score 88 |
| Public Art | 3pts | 100 pieces of public art |
| Sports Facilities | 4pts | 100 public sports fields/facilities |
| Bike Infrastructure | 4pts | 24 miles of protected bike lanes and 100 miles of unprotected bike lanes |
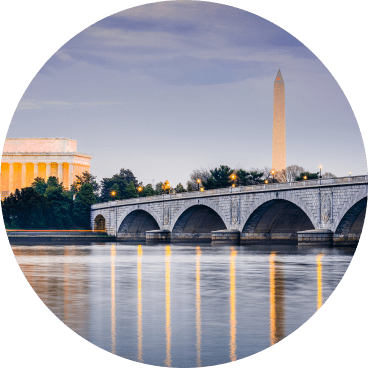
Washington, D.C. might be known for Capitol Hill and the freshly-mowed lawns of the National Mall, but the U.S. capital has also prioritized landscaping for the rest of D.C. residents. Washington D.C. ranks number 1 for TPL Parkscore, meaning parks are within walking distance for nearly the entire population.
Washington D.C. must also look great from an airplane, as the city enjoys a Tree Equity Score of 88. In addition to foliage, D.C. maintains a collection of 100 pieces of public art on display for residents and visitors to enjoy.
You might have heard of the Annual Congressional Baseball Game for Charity, but did you know that the city also tends to over 100 sports facilities for public use? Nothing quite like leaving politics behind to toss a football with friends.
If you’re tired of sitting in traffic and are itching for some movement, Washington D.C. has taken you into consideration. With 24 miles of protected bike lanes and 100 miles of unprotected bike lanes, you can be assured that getting around on a bike in D.C. will be a breeze.
4. Denver, Colorado
| The Best Landscaped Cities in the U.S. | ||
| TPL Parkscore | 4pts | Ranked #13 |
| Tree Equity Score | 5pts | Score 90 |
| Public Art | 5pts | 400 pieces of public art |
| Sports Facilities | 4pts | 100 public sports fields/facilities |
| Bike Infrastructure | 2pts | 137 miles of bike lanes |
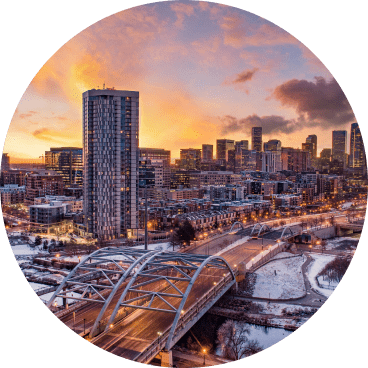
Denver, CO has a TPL Parkscore ranking of 13, securely positioned within the desirable first 20 spots. The Mile High City also has no shortage of trees, as they brag a Tree Equity Score of 90.
If you’re on the lookout for a city that resembles an outdoor art museum, look no further. Denver displays 400 pieces of public artwork for residents to admire on a casual walk or weekend outing.
Keen to take a break from the T.V.? The Broncos aren’t the only team encouraged to play seasonal sports in Denver. With roughly 100 public sports facilities, you too can throw a ball like a quarterback (or try to, at least).
Denver is known for beautiful views and striking mountain tops, and while the city doesn’t detail bike lane specifics, it does reveal 137 miles of bike lanes to absorb those views en route to work, on a casual ride, or during a weekend race.
5. Chicago, Illinois
| The Best Landscaped Cities in the U.S. | ||
| TPL Parkscore | 4pts | Ranked #12 |
| Tree Equity Score | 4pts | Score 87 |
| Public Art | 3pts | 100 pieces of public art |
| Sports Facilities | 4pts | 180 public sports fields/facilities |
| Bike Infrastructure | 5pts | 40 miles of protected bike lanes, 129 bikeways, and 104 miles of greenways and trail space |
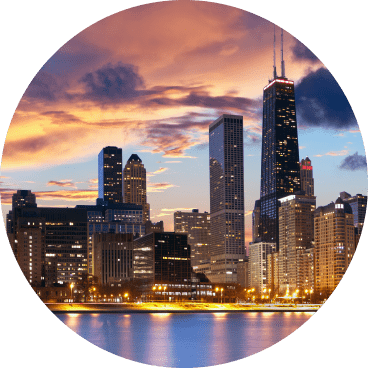
Chicago is well known for food, art, and music, but the city’s allure isn’t limited to those things. Chicago is ranked number 12 by TPL Parkscore, with impressive park access for residents and a significant amount of city resources dedicated toward parks and recreation.
Chicago’s Tree Equity Score lingers at an 87, meaning there are a healthy number of trees within the city and they are distributed evenly throughout Chicago communities.
With such a name for art, a robust public art collection in Chicago should come as no surprise, but the city enjoys over 100 pieces of permanently sited pieces displayed around the city.
Not in the mood for art? Not a problem. Besides the famous Wrigley stadium (it’s a bummer it’s not for public use), Chicago residents enjoy 180 athletic fields scattered across the city. In addition to that, the bikers of the city also reap the benefits of 40 miles of protected bike lanes, 129 bikeways, and 104 miles of greenways and trail space. Get that helmet fastened!
Honorable Mentions
Listed below are four honorable mentions. These are four additional cities that have clearly invested care and resources into keeping their city liveable, loveable, and – dare we say it – green!
6. Minneapolis, Minnesota
| The Best Landscaped Cities in the U.S. | ||
| TPL Parkscore | 5pts | Ranked #3 |
| Tree Equity Score | 4pts | Score 89 |
| Public Art | 2pts | 92 pieces of public art |
| Sports Facilities | 3pts | 58 public sports fields/facilities |
| Bike Infrastructure | 5pts | 98 miles of bike trails, 16 miles protected bike lanes, 100 miles bikeways/trails |
7. Cincinnati, Ohio
| The Best Landscaped Cities in the U.S. | ||
| TPL Parkscore | 5pts | Ranked #6 |
| Tree Equity Score | 5pts | Score 90 |
| Public Art | 4pts | 200 pieces of public art |
| Sports Facilities | 3pts | 61 public sports fields/facilities |
| Bike Infrastructure | 2pts | 48 miles of bike lanes – streets and trails/trails |
8. San Francisco, California
| The Best Landscaped Cities in the U.S. | ||
| TPL Parkscore | 5pts | Ranked #7 |
| Tree Equity Score | 4pts | Score 87 |
| Public Art | 5pts | 877 pieces of public art |
| Sports Facilities | 3pts | 63 public sports fields/facilities |
| Bike Infrastructure | 2pts | 34 miles of bike lanes |
9. Albuquerque, New Mexico
| The Best Landscaped Cities in the U.S. | ||
| TPL Parkscore | 5pts | Ranked #24 |
| Tree Equity Score | 4pts | Score 87 |
| Public Art | 5pts | 826 pieces of public art |
| Sports Facilities | 3pts | 21 public sports fields/facilities |
| Bike Infrastructure | 2pts | 400 miles of bike lanes and trails |
All Cities
Listed below are the scores for all 50 cities we analyzed. Please note that the cities that have a “0” in any given category does not mean they actually have “0” items in those categories.
A “0” means that there was not an easily accessible system in place for determining the number of public art displays, number of sports facilities, or miles of bike lanes in that city.
This impacted certain scores, but not enough to move any one score to the top of the list.
| The Best Landscaped Cities in the U.S. | ||||||
| Cities | TPL Parkscore | Tree Equity Score | Public Art Initiatives | Sports Facilities | Bike Infra | Total Score |
| Seattle, WA | 5 | 5 | 5 | 5 | 4 | 24 |
| Portland, OR | 5 | 4 | 3 | 5 | 5 | 22 |
| Washington, DC | 5 | 4 | 3 | 4 | 4 | 20 |
| Denver, CO | 4 | 5 | 5 | 4 | 2 | 20 |
| Chicago, IL | 4 | 4 | 3 | 4 | 5 | 20 |
| Minneapolis, MN | 5 | 4 | 2 | 3 | 5 | 19 |
| Cincinnati, OH | 5 | 5 | 5 | 3 | 2 | 19 |
| San Francisco, CA | 5 | 5 | 5 | 3 | 2 | 19 |
| Albuquerque, NM | 3 | 4 | 5 | 2 | 5 | 19 |
| New York, NY | 4 | 4 | 5 | – | 5 | 18 |
| Milwaukee, WI | 3 | 4 | 3 | 5 | 3 | 18 |
| Irvine, CA | 5 | 3 | – | 5 | 4 | 17 |
| Madison, WI | 4 | 4 | 3 | 4 | 2 | 17 |
| Plano, TX | 4 | 4 | 2 | 4 | 3 | 17 |
| Pittsburg, PA | 4 | 4 | 3 | 4 | 2 | 17 |
| Boise, ID | 4 | 4 | 3 | 4 | 2 | 17 |
| St. Louis, MO | 3 | 3 | 5 | 3 | 3 | 17 |
| Atlanta, GA | 3 | 5 | 3 | 3 | 3 | 17 |
| Austin, TX | 1 | 5 | 4 | 3 | 4 | 17 |
| Dallas, TX | 1 | 4 | 5 | 5 | 2 | 17 |
| Arlington, VA | 5 | 4 | 2 | 2 | 3 | 16 |
| St. Petersburg, FL | 4 | 4 | 5 | 2 | 2 | 16 |
| Sacramento, CA | 2 | 3 | 5 | 4 | 3 | 16 |
| San Jose, CA | 2 | 2 | 4 | 3 | 5 | 16 |
| St. Paul, MN | 5 | 5 | 2 | 2 | 2 | 15 |
| Philadelphia, PA | 2 | 4 | 0 | 5 | 4 | 15 |
| New Orleans, LA | 2 | 3 | 4 | 3 | 3 | 15 |
| Baltimore, MD | 3 | 3 | 5 | 0 | 3 | 14 |
| Honolulu, HI | 2 | 1 | 5 | 4 | 2 | 14 |
| Richmond, VA | 2 | 3 | 2 | 4 | 3 | 14 |
| Boston, MA | 4 | 4 | 0 | 3 | 2 | 13 |
| Fremont, CA | 3 | 4 | 2 | 2 | 2 | 13 |
| Miami, FL | 2 | 1 | 2 | 3 | 5 | 13 |
| Las Vegas, NV | 1 | 3 | 2 | 2 | 5 | 13 |
| Jersey City, NJ | 1 | 4 | 3 | 2 | 2 | 12 |
| Lincoln, NE | 1 | 4 | 2 | 0 | 3 | 11 |
| Toledo, OH | 2 | 3 | 2 | 2 | 3 | 11 |
| Henderson, NV | 4 | 3 | 0 | 0 | 3 | 10 |
| San Diego, CA | 3 | 2 | 0 | 0 | 5 | 10 |
| Kansas City, MO | 3 | 5 | 2 | 0 | 0 | 10 |
| Omaha, NE | 1 | 5 | 4 | 0 | 0 | 10 |
| Santa Clarita, CA | 1 | 2 | 2 | 2 | 3 | 10 |
| Virginia Beach, VA | 1 | 4 | 3 | 0 | 2 | 10 |
| Spokane, WA | 4 | 3 | 2 | 0 | 0 | 16 |
| Cleveland, OH | 3 | 3 | 0 | 3 | – | 9 |
| Buffalo, NY | 2 | 3 | 4 | 0 | 0 | 9 |
| North Las Vegas, NV | 2 | 1 | 2 | 2 | 2 | 9 |
| Aurora, CO | 1 | 4 | 2 | 2 | 0 | 9 |
| Tampa, FL | 1 | 3 | 2 | 0 | 3 | 9 |
Methodology
For this study, we took an in-depth look at 50 different cities and 5 different criteria for each city. We ranked them by TPL Parkscore, Tree Equity Score, bike infrastructure, the amount of public art they have displayed outdoors, and the cities’ outdoor sports fields/facilities. Below is the point system we used.
| The Best Landscaped Cities in the U.S. | |||||
| Criteria | 5 pts | 4 pts | 3 pts | 2 pts | 1 pts |
| TPL ParkScore | Ranking 1-10 | Ranking 11-20 | Ranking 21-30 | Ranking 31-40 | Ranking 41-50 |
| Tree Equity Score | Score 90-95 | Score 85-89 | Score 80-84 | Score 75-79 | Score 69-74 |
| Public Art | 400-900 displayed pieces | 200-300 displayed pieces | 100-199 displayed pieces | Score 10-99 displayed pieces | 0-9 displayed pieces |
| Public Sport Facilities | 200-350 sports fields | 100-180 sports fields | 40-99 sports fields | 10-39 sports fields | 0-9 sports fields |
| Bike Infrastructure | 400-650 miles of bike lanes, greenways and pathways | 200-300 miles of bike lanes, greenways and pathways | 100-199 miles of bike lanes, greenways and pathways | 10-99 miles of bike lanes, greenways and pathways | 0-9 miles of bike lanes, greenways and pathways |
TPL Parkscore
The TPL Parkscore is a score calculated by the Trust for Public Land, a national nonprofit that helps create parks and protect land. The TPL Parkscore examines five characteristics of what the nonprofit has determined to make an exceptional park system.
These five characteristics are:
- Access – portion of residents within a 10 minute walk of a park
- Acreage – median park size and percentage of city dedicated to parks
- Investment – three-year average of all private and public spending
- Amenities – basketball hoops, dog parks, playgrounds, bathrooms, rec and senior centers, splash pads
- Equity – Distribution of parks and park space by race and income
The score considers factors such as how close residents are to a park, and if there is park equity for high income, middle income, and low income individuals, as well as individuals of different races/ethnicities.
The score also includes the percentage of city land used for parks and recreation, and amenities like basketball hoops, dog parks, and bathrooms. The data is impressive, and definitely worth checking out.
Tree Equity Score
The Tree Equity Score, as taken from their website, is “a nationwide score that highlights inequitable access to trees.” In locations where the score is higher, it means that the city has enough trees (or close to enough) trees planted. Where the score is lower, tree-planting should be a priority, especially in communities with fewer trees.
Why is the tree canopy so important? Aside from trees being inarguably beautiful, they also have a positive impact on public health, water, air quality, and climate. Not to mention shade on those sweltering hot summer days.
Public Art
How often do you think about the sculptures in your city center, or on display within a local park? Do you notice those colorful painted telephone boxes that light up the dull cement sidewalks?
It’s easy to take for granted, but public art is everywhere in cities across the U.S. – yours included. City art committees push programs to preserve public art pieces and inspire artists so that their city is vibrant for residents and visitors alike.
Public art is an integral part of public landscaping, so we ranked cities with the most robust display of outdoor public art.
Public Sports Fields/Facilities
What’s a well-landscaped city without public access to soccer fields and baseball diamonds? We took a deep-dive into parks and recreation to determine which cities have paved the way for local athleticism.
The number of and type of public sports facilities will, of course, vary based on population size and city size. But we examined cities that put a little extra tender loving care into their outdoor sports facilities, and ranked them accordingly.
Bike Infrastructure
In 2021, there were 966 cyclist fatalities caused by motor vehicles in the U.S. If you are a cyclist or know one, you know how common accidents are. And while sharing the road is a well-known aspect of city life, some cities take biker accessibility and safety more seriously than others.
In calculating our bike infrastructure rating, we considered the number of bike lanes and greenways, but placed extra value on protected bike lanes. If a city has more protected bike lanes but less greenways, we bumped them up a tier.

